Top 10 Bitcoin Charts
Bitcoin is growing. It has skyrocketed to above $1,200 at the end of last year and now it’s hovering around $800.
For the convenience of Bitcoin enthusiasts, i have listed the top 10 Bitcoin charts and figures for easy reference. There is no particular order or preference in the listing. If i have omitted or missed an important chart, feel free to notify me in the comments below.
1. Price Chart
This chart displays the latest trading price of bitcoin against a number of currencies and ranks the exchanges by 30-day volume.
2. Exchange Volume Distribution
This is a pie chart that displays trading volume distribution by various exchange and by currency.
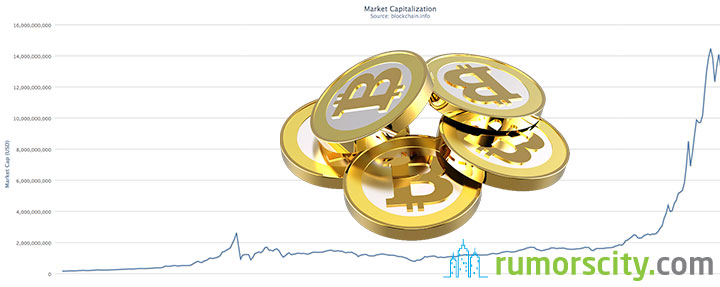
3. Market Capitalization
This graph displays the historical number on market capitalization of Bitcoin which is derived from multiplying the total number of Bitcoins in existence by the exchange rate in USD for that day. It is the Bitcoin monetary base.
4. Number of Daily Transactions
This is a historical graph display of the total number of unique Bitcoin transactions per day.
5. Daily Transaction Volume
This measures the daily transaction volume per day in USD. There is a similar graph with a visualized Bitcoin network activity that measures BTC transactions, block creation and currency traded that is updated in real time.
6. Largest Recent Transactions
This is a top 100 list with the largest actual transaction sizes in Bitcoin occurring on the network.
7. Average Transaction Confirmation Time
This measures the average amount of time that it takes for a transaction to be accepted into a block. Reasonable estimates differ on the amount of time and confirmations for a transaction to be considered cleared and good but that appropriate risk level would be associated with the transaction’s value.
8. Network Hashing Rate
This displays hashing difficulty and the estimated number of Giga hashes per second that the network is performing for various time windows. Difficulty measures how difficult it is to find a new block compared to the easiest it can ever be. Difficulty adjusts every 2016 blocks, or two weeks, and to find a block, the SHA-256 hash of a block’s header must be lower than or equal to the current target for the block to be accepted by the network.
9. Hash Rate Distribution
This pie chart is an estimation of hash rate distribution among the largest mining pools. It is an important chart to monitor as there are 51 Attack risks when a single operator controls more than 50% of the overall hashing power.
10. Bitcoin Days Destroyed
Bitcoin Days Destroyed for any given transaction is calculated by taking the number of Bitcoin in a transaction and multiplying it by the number of days it has been since those coins were last spent. It is considered a measure of monetary velocity. The on-going cumulative version can be found here.


